
Breweries typically monitor fermentation by analyzing broth composition. Alcohols, esters, acids and residual sugars are quantified via chromatography-based assays. While reliable, these tests are time-consuming and only yield batch-average results.
Now, a new study demonstrates that rapid, label-free readings from individual yeast cells can be translated into many of these same key process metrics—while also uncovering cell-to-cell variation masked by bulk testing methods.
Published recently in the journal Bioresource Technology, the research was led by scientists from the Qingdao Institute of Bioenergy and Bioprocess Technology (QIBEBT) of the Chinese Academy of Sciences, in partnership with external collaborators. The team developed a novel workflow dubbed "process ramanomics," which is based on spontaneous single-cell Raman spectroscopy.
To validate the approach, the researchers tracked an industrial beer fermentation process using the lager yeast Saccharomyces pastorianus, sampling a single production batch over an eight-day period. At each stage of fermentation, they collected high-throughput Raman spectra from individual cells (a "ramanome") and matched these unique molecular fingerprints to conventional lab measurements of 43 extracellular phenotypes in the fermentation medium.
Using multivariate regression analysis, the team found that ramanomes could accurately predict 19 extracellular phenotypes. This included four higher alcohols, four esters, four amino acids, two organic acids, four mono- and disaccharide substrates, and the alcohol-to-ester ratio—a commonly used indicator tied to beer flavor balance. In practical terms, a single, rapid cellular analysis can now replace multiple time-intensive chemical assays—without sacrificing single-cell resolution details.
Because the models output cell-level predictions, the researchers also tracked phenotypic heterogeneity over time. Different metabolite classes displayed distinct heterogeneity trajectories, and for several phenotypes higher heterogeneity tended to accompany lower metabolite levels—suggesting that dispersion among cells may be a useful process-state indicator.
To explore the underlying biological mechanisms, the authors developed a new analytical tool called Intra-Ramanome Correlation Analysis (IRCA). This method extracts correlation networks linking intracellular Raman spectral features to extracellular metabolites and substrates. Their IRCA-based analysis identified carbohydrates as the most dynamically changing intracellular component pool, and further revealed that protein-associated Raman signals are closely linked to alcohol and ester production in the early stages of fermentation.
"Instead of waiting for tank chemistry to drift before we notice it, we can now read the cells directly—and infer multiple process outputs from their metabolic fingerprints," said Prof. XU Jian, co-corresponding author of the study.
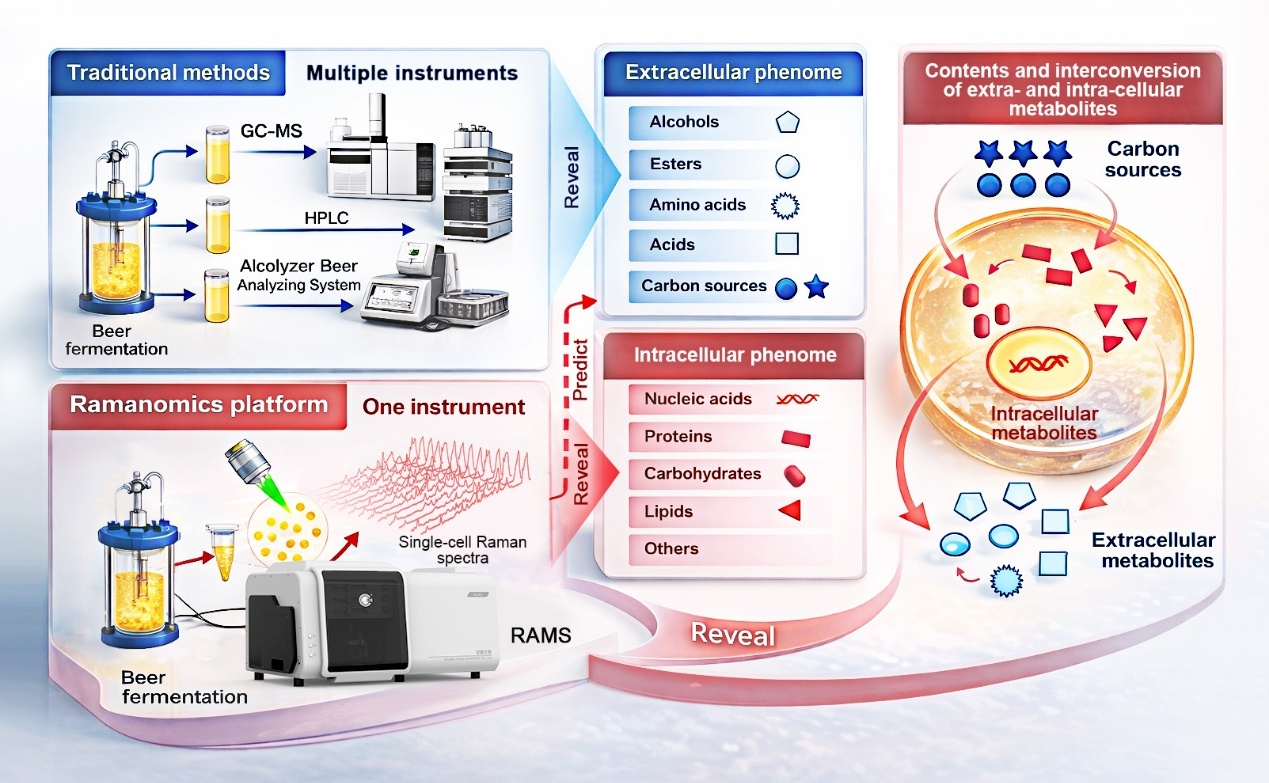
Overview of "process ramanomics". Single-cell Raman fingerprints collected across fermentation provide a fast, label-free window into brewing progress with single-cell resolution. (Image by LIU Yang)
LIU Yang
Qingdao Institute of Bioenergy and Bioprocess Technology
E-mail: liu_yang@qibebt.ac.cn
Researchers from the Qingdao Institute of Bioenergy and Bioprocess Technology have developed a way to rapidly determine exactly which microalgae can most readily convert carbon dioxide into valuable compounds that can be used for fuels, food and drugs.

Scientists from the Qingdao Institute of Bioenergy and Bioprocess Technology have developed an investigative technique that uses single-cell Raman microspectrometry to derive a dynamic metabolic profile from just one sample rapidly and cheaply.

86-10-68597521 (day)
86-10-68597289 (night)

52 Sanlihe Rd., Xicheng District,
Beijing, China (100864)
Copyright © 2002 - Chinese Academy of Sciences


