Newsroom


Over 40,000 seamounts are scattered across the ocean floor. Some form linear chains, others appear randomly. But what creates them? By reconstructing the dynamic evolution of Earth's interior over the past 270 million years, a recent study reveals that all seamounts — whether they form linear age-progressive hotspot chains or appear as scattered, isolated cones — are produced by deep plume-related activity.
The study, carried out by a research team led by Professor LIU Lijun at the Institute of Geology and Geophysics (IGG) of the Chinese Academy of Sciences (CAS), was published in Nature Geoscience on June 10.
The study has identified a unified deep-Earth dynamic mechanism responsible for the formation of widely distributed seamounts, thereby extending and refining the classical mantle plume model, the researchers said.
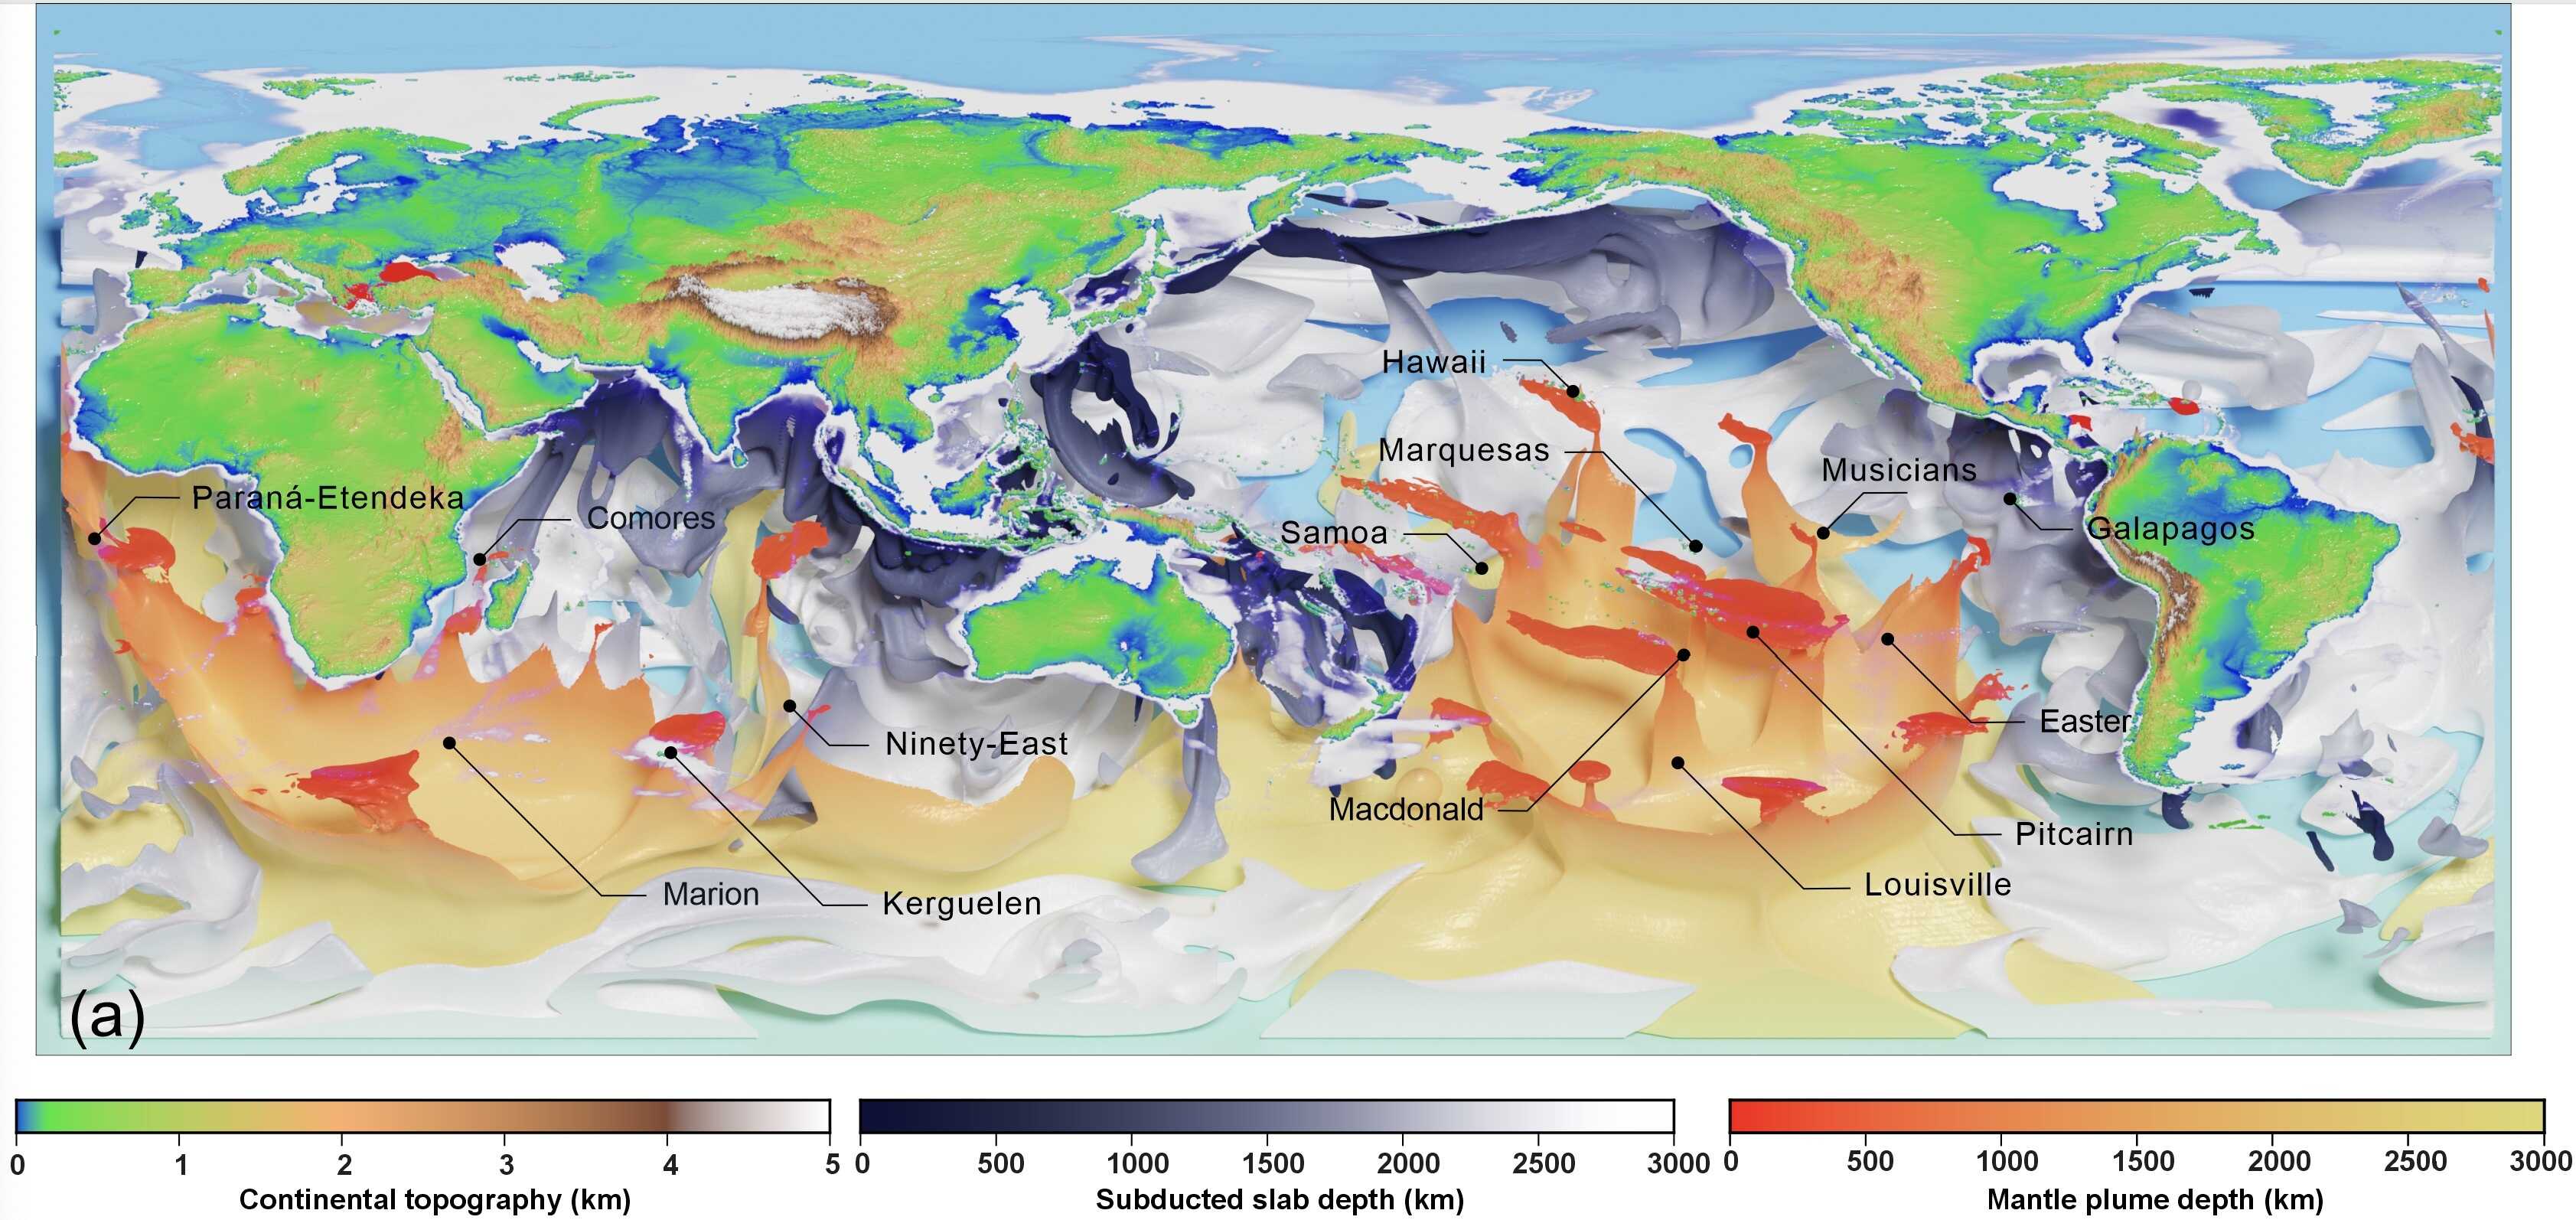
Comparison between the modeled present-day 3D mantle plume structure and geological observations. The upper surface shows continental topography, while white regions show continental shelves, seamounts, island arcs, and other geological features. Orange isosurfaces represent mantle plumes, while gray isosurfaces indicate subducting slabs deeper than 300 km. (Image by IGG)
According to the classical hotspot hypothesis, hot mantle plumes rising from the core-mantle boundary induce partial melting beneath moving tectonic plates, producing volcanic chains such as the Hawaiian Islands. However, only about 50 seamount chains conform to the classical hotspot model.
This study resolves a decades-long question: Are all seamounts generated by hotspot and mantle plume activity? If so, how can such a limited number of hotspots explain the widespread occurrence of seamounts throughout the global oceans?
To answer the question, the research team used unprecedented computational power and model resolution to reconstruct the dynamic evolution of Earth's interior over the past 270 million years. Based on these simulations, the team analyzed the spatiotemporal behavior of deep-rooted mantle plumes and their role in generating volcanism within ocean basins.
The model reveals that the formation and evolution of both linear, well-organized seamount chains and isolated scattered seamounts are closely associated with asthenospheric thermal anomalies generated by mantle plumes originating from the core-mantle boundary.
Taking the Pacific plate as an example, during the early stages of mantle plume ascent, large amounts of plume-derived heat accumulate beneath the young Pacific lithosphere, forming extensive asthenospheric thermal anomalies. These anomalies exhibit a clear spatiotemporal correspondence with scattered seamounts in the Western Pacific Seamount Province.
During subsequent evolution, mantle plumes may split either from their lower-mantle roots or within the mantle transition zone, generating secondary mantle plumes. This process further increases the number of modeled hotspots and creates favorable conditions for the formation of additional seamount chains.
The hot material associated with these plumes can persist within the asthenosphere over geological timescales, gradually migrating and dispersing under the influence of mantle convection. The modeled temperatures of these residual thermal anomalies show a significant linear correlation with observed seamount elevations at corresponding locations.
These results suggest that asthenospheric thermal anomalies can generate numerous small and scattered seamounts, confirming that such thermally anomalous regions serve as "seamount brewing zones".
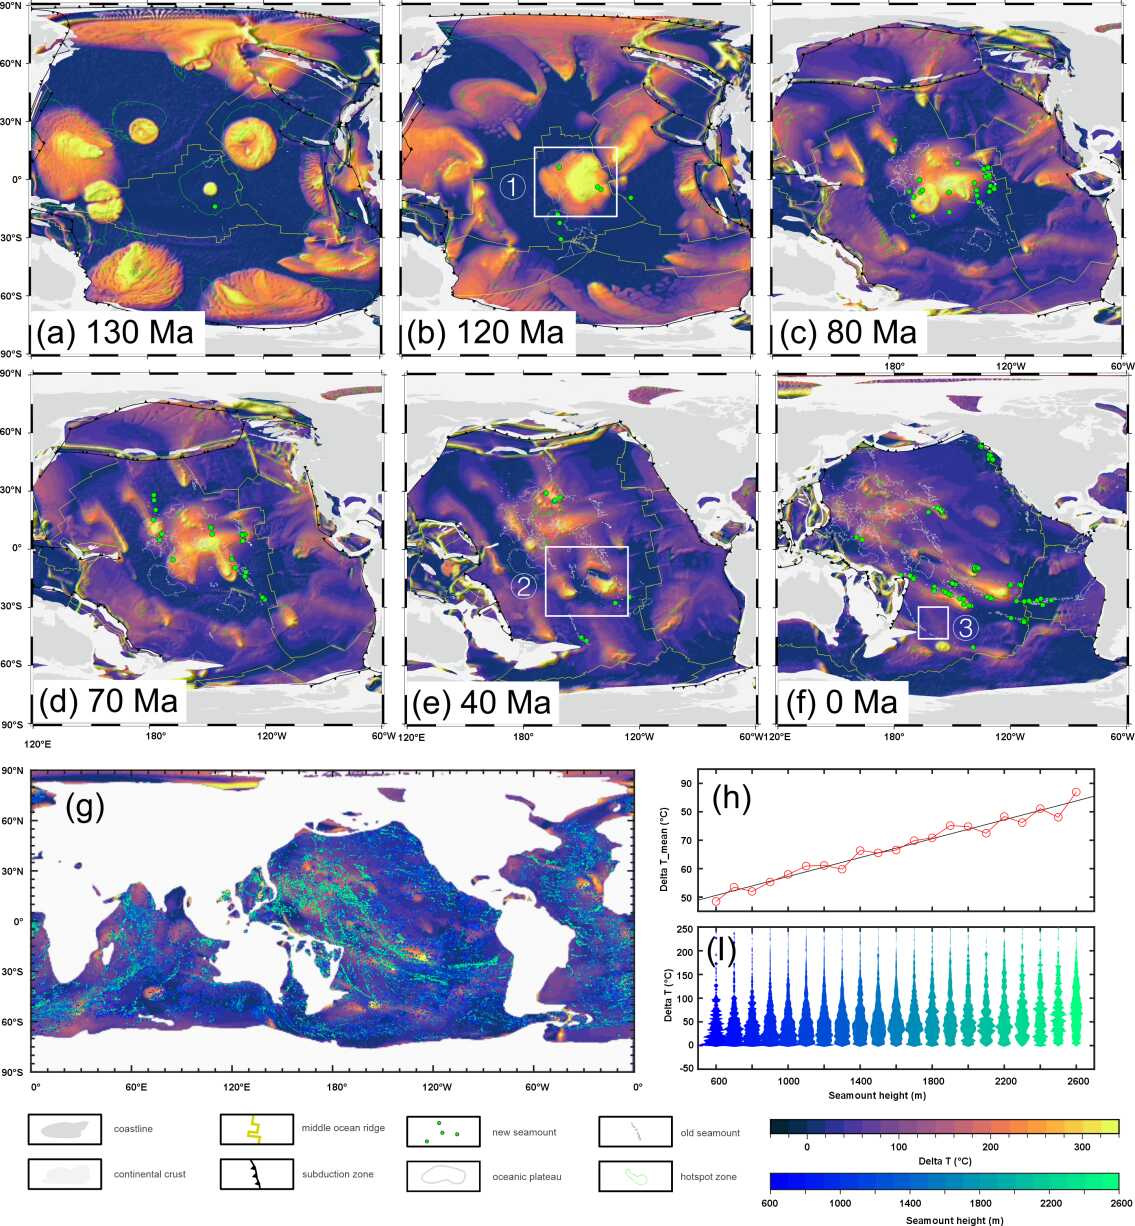
Significant spatiotemporal correlations between mantle plume-induced asthenospheric thermal anomalies and observed seamount occurrences. (a–f) Background colors denote asthenospheric temperature anomalies at different evolutionary stages. Green dots mark the paleo-emplacement locations of observed seamounts. (g) Locations and elevations of all identified seamounts. (h) Relationship between observed seamount elevations and modeled present-day thermal anomalies directly beneath each seamount. The red line represents the mean thermal anomaly, and the black line denotes the linear regression fit. (i) Probability distribution of modeled thermal anomalies for different seamount-elevation classes. (Image by IGG)