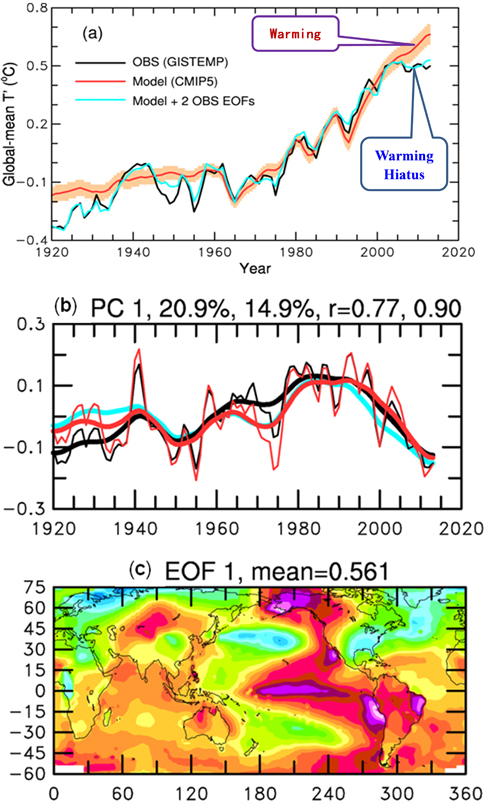
Atmospheric greenhouse gases (GHGs) continue to rise during recent years, yet global-mean surface temperature has shown no clear warming since about year 2000. This slowdown in global warming, often referred to as the global warming "hiatus", is in sharp contrast to model simulations which on average show strong warming since 2000. This large model-versus-observation discrepancy in global warming rate has attracted considerable attention in climate research and in news media, since it has the potential to undermine the credibility of climate models and their projected future climate changes.
Naturally, people would ask the question: if the models cannot simulate the current global warming rate, how can we trust their projections of future climate change? This is a very reasonable question that deserves a satisfactory answer from the climate science community. The global warming hiatus has also been used to dismiss climate science entirely by some deniers of global warming. Thus, explaining the warming hiatus has become an urgent task for climate scientists.
Recent studies have attributed the warming hiatus to decadal cooling in the tropical Pacific, intensifying trade winds, changes in El Niño activity, increasing volcanic activity and decreasing solar irradiance that have not been adequately accounted for in model simulations. However, despite large efforts by many groups, a satisfactory explanation of the warming hiatus has remained elusive.
In a new study published on 13th April 2015 by Nature Climate Change, Professor Aiguo DAI of the University of Albany of the State University of New York (SUNY), who studied and worked at IAP/CAS from 1985-1990, and his co-authors, including Dr. DAI Xingang of Institute of Atmospheric Physics/CAS, analyzed observed and model-simulated global temperature data and quantified the contributions of internal climate variability to decadal changes in global warming rate since 1920. A key new aspect of this study was the use of the multi-model ensemble simulations to estimate the forced global warming and separate it from internal climate variations.
Their analyses show that the Inter-decadal Pacific Oscillation (IPO), a prominent natural mode of multi-decadal variations in Pacific sea surface temperatures, has been associated with large temperature anomalies over both ocean and land. Combined with another leading mode of internal climate variations, the IPO explains essentially all the difference between observed and model-simulated global warming rates on decadal time scales since 1920, and in particular the warming hiatus since year 2000. The spatial patterns of the IPO-induced temperature changes match observations but differ from those associated with GHG-induced warming or aerosol-induced cooling.
The authors conclude that internal climate variations, mainly through the IPO, were largely responsible for the recent slowdown, as well as for earlier slowdowns and accelerations in decadal global warming rates since 1920. This finding is consistent with other recent studies and supports the notion that the recent warming hiatus resulted primarily from natural climate variations, rather than from aerosols or other forcing missed by the models.
Climate models still have difficulties in simulating observed IPO and other natural climate variations due to deficiencies in model physics and model starting conditions. Thus, discrepancies between observed and model-simulated global warming rates on decadal time scales should be expected, rather than taken as surprises. The model-versus-observation discrepancies on decadal scales do not imply that the model-simulated climate change due to rising greenhouse gases and other anthropogenic forcing is wrong. Recent history suggests that the IPO could reverse course soon. Should that happen, we could see accelerated global warming rates in the coming decades.

Figure: (a) Comparison of global-mean surface temperature anomalies for 1920-2013 from observations (black), multi-model ensemble simulations (red, shading = 95% confidence interval), and the model temperature anomalies plus the anomalies represented by two leading modes of internal variability (blue). The temporal coefficients (b, thick lines are smoothed version, black line for GISTEMP and red line for HadCRUT4) and spatial patterns (c, for GISTEMP) of the first leading mode of observed temperature anomaly fields (with forced warming being removed). The blue line in (b) is an IPO index and the blue vertical bar in (a) is an estimate of the internal variability range. The temporal and spatial patterns link this mode to the well-known Inter-decadal Pacific Oscillation (IPO). (Image by DAI et. al.)
Reference:
Dai, A., J.C. Fyfe, S.-P. Xie, and X. Dai, 2015: Decadal modulation of global-mean temperature by internal climate variability. Nature Climate Change, DOI: 10.1038/nclimate2605. Published online on 13th April 2015.
Contact:
Dr. Aiguo DAI
E-mail: adai@albany.edu

86-10-68597521 (day)
86-10-68597289 (night)

52 Sanlihe Rd., Xicheng District,
Beijing, China (100864)

