
An Earth observation satellite, called TanSat, has produced its first global carbon dioxide maps. TanSat was launched by a collaborative team of researchers in China, and these maps are the first steps for the satellite to provide global carbon dioxide measurements for future climate change research. The researchers published the maps, based on data collected in April and July 2017, in the latest edition of the journal Advances in Atmospheric Sciences, a Springer journal.
The article is featured in the cover of Issue 6 of Advances in Atmospheric Sciences (AAS) in 2018. (Image by AAS)
"Global warming is a major problem, for which carbon dioxide is the main greenhouse gas involved in heating the troposphere," wrote YANG Dongxu, first author of the paper and one of the team leaders of the group that analyzes TanSat's data at the Institute of Atmospheric Physics of the Chinese Academy of Sciences. "However, the poor availability of global carbon dioxide measurements makes it difficult to estimate carbon dioxide emissions accurately."
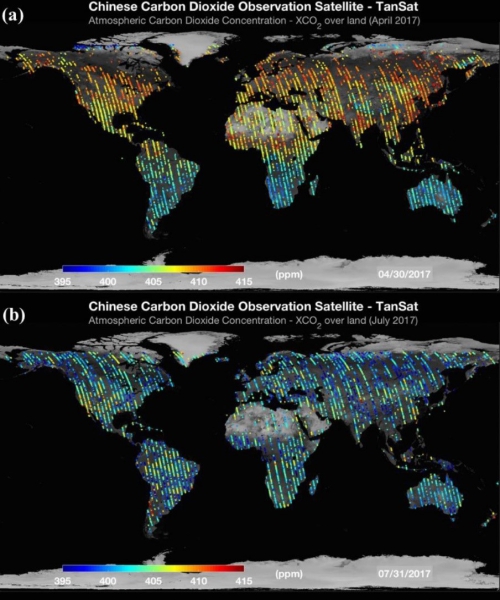
Global XCO2 maps produced from TanSat in nadir mode in (a) April and (b) July 2017. The colored marks indicate the XCO2 values and the color scale bar is shown at the bottom of each figure. (Image by TanSat)
TanSat, launched in December 2016, is the third satellite in orbit capable of monitoring carbon dioxide with hyperspectral imaging, and it is China's first greenhouse gas monitoring satellite.
The satellite measures not only the presence of carbon dioxide, but also what YANG calls carbon dioxide flux—the source and sink of carbon dioxide on Earth's surface. The satellite can measure carbon dioxide's absorption in the near-infrared zone for a better picture of carbon dioxide's behavior on and around Earth.
The TanSat maps were completed within a year of the satellite's launch.
"TanSat can provide global carbon dioxide measurements, which will reduce the uncertainty of flux estimation and support studies on climate change," YANG said.
TanSat's data was validated by YANG and his team through carbon dioxide measurements that took on Earth's surface and a comprehensive algorithm.
"Based on the maps, a seasonal decrease in carbon dioxide concentration from spring to summer in the Northern Hemisphere is obvious, and results from a change in the rate of photosynthesis," YANG wrote. "Emission hotspots due to anthropogenic activity, such as industrial activity and fossil fuel combustion, are clearly evident in eastern China, the eastern United States, and Europe."
YANG and the rest of the TanSat team will continue to gather and analyze the global carbon dioxide data in an effort to better understand the concentration and impact of the greenhouse gas.
"The first global CO2 map of April and July in 2017 is a milestone of TanSat achievement, with the further improvement of data retrieval, it will provide more and better CO2 measurements in future," YANG said.
This work was supported by the Ministry of Sciences and Technology in China, the Chinese Academy of Sciences, the China Meteorological Administration, the National Key R&D Program of China, the National High-Tech Research and Development Program and the External Cooperation Program of the Chinese Academy of Sciences.

86-10-68597521 (day)
86-10-68597289 (night)

52 Sanlihe Rd., Xicheng District,
Beijing, China (100864)
Copyright © 2002 - Chinese Academy of Sciences


