El Niño-Southern Oscillation (ENSO) phenomenon is the dominant interannual variability in the tropical Pacific, which can impact weather and climate across the globe. The 2015/16 El Niño event lasted for 13 months and was very strong ENSO event. In early 2014, many people predicted that a very strong El Niño event would develop in 2014, with strength similar to the 1997/98 El Niño event. However, in the following months in 2014, the SST anomaly unexpectedly fell back to a neutral state. And then a weak El Niño conditions appeared in May 2015. Many studies reported this false alarm.
Based on the climate data sets from 1950 to 2016, the impact of solar activity on El Niño Modoki was examined in a paper by Professor XIAO Ziniu and his doctoral student HUO Wenjuan, from the Institute of Atmospheric Physics, Chinese Academy of Sciences. A significant positive correlation was found between sunspot numbers and El Niño Modoki index (EMI), both of which have clear similar decadal periods. A longer historical data set (1890−2015) analysis revealed that a cold event-like pattern appeared in the tropical Pacific in the Northern Hemisphere winter (December–February, DJF) in solar peak years, and an El Niño Modoki event would most likely occur in following one or two years. Due to the 24th solar cycle reached its peak in 2014, the impact of the strong solar activity on the 2015/16 El Niño event could not be neglected.

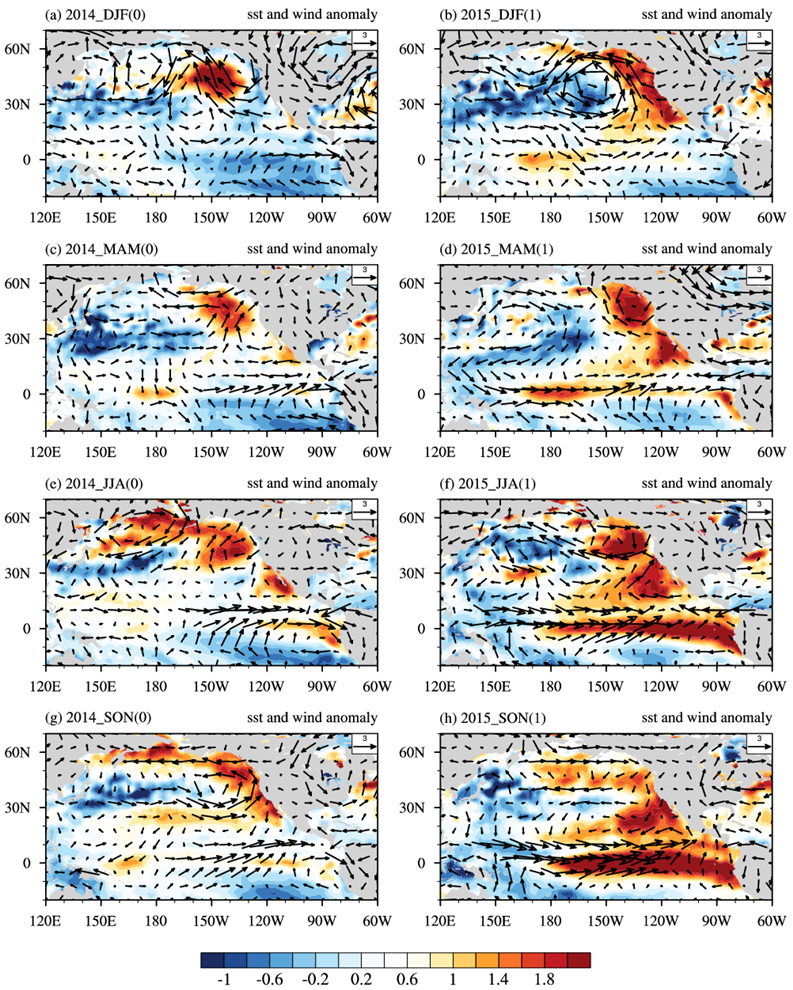
Figure 1. Seasonal mean SST (contours; units: °C) and 850 hPa wind (vectors; units: m s−1) anomalies in 2014 and 2015. (Huo and Xiao, 2016)

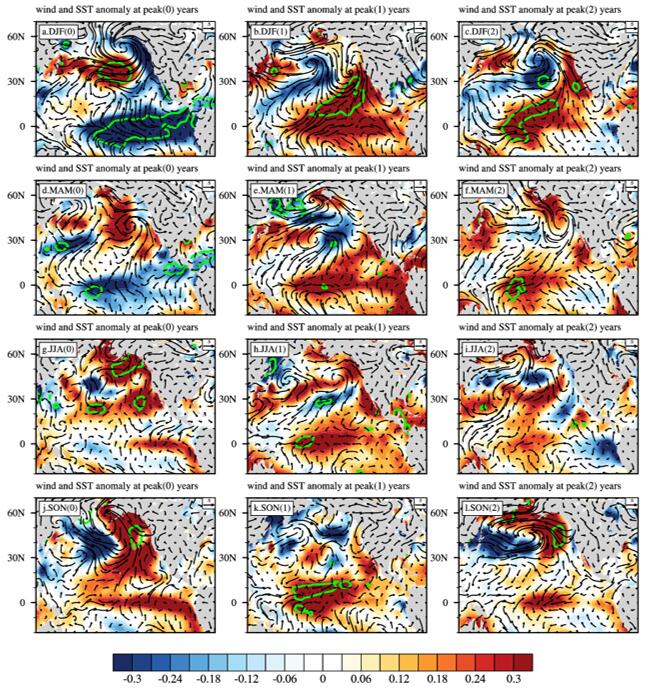
Figure 2. Composites of seasonal mean SST (contours; units: °C) and 850 hPa wind (vectors; units: m s−1) anomalies during peak years of the solar cycles, and the following one and two years. Regions within the green contours are above the 90% confidence level (Student’s t-test). (HUO and Xiao, 2016)
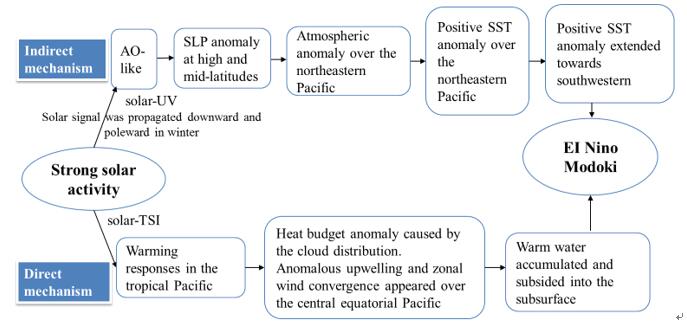
The seasonal mean SST anomaly (contours) and wind anomaly at 850 hPa (vectors) from the winter of 2014 to the fall of 2015 are shown in Figure 1., which have similar characters with the composite results of historical data sets (as shown in Figure 2.) . As shown in Figure 1.a and Figure 2.a, the patterns of SST anomalies in the equatorial Pacific resemble a La Nina-like event in the peak years of solar cycle [peak (0) and the 2014]. The positive SST anomalies are found in the central equatorial Pacific and the northeastern Pacific within one year after the solar peak (peak (1) and the 2015), as shown in the second columns in Figure 1 and Figure 2 respectively. The 2015/16 El Niño event is more like a mixture of two types of El Niño — EP (eastern Pacific) El Niño and El Niño Modoki, of which the El Niño Modoki component might also have resulted from high solar activity. The mechanisms involved in this process are shown in Figure 3.

Figure 3. Possible mechanisms for the El Niño Modoki development in the one and two years following the solar peak years (Figure plotted by HUO Wenjuan)
“The 2015/16 event may not decay as quickly as the EP El Niño event because of the El Niño Modoki component impacted by the strong solar activity.” Prof. XIAO concluded, “In consequence, the 2015/16 El Niño event started as an El Niño Modoki event in the winter (DJF) 2015, developed into a mixture El Niño event, and then ended as an El Niño Modoki event in the autumn (SON) of 2016.”

86-10-68597521 (day)
86-10-68597289 (night)

52 Sanlihe Rd., Xicheng District,
Beijing, China (100864)

