
Headlines
Ocean Temperatures Help Make 2023 the Hottest Year on Record
|
Print


A small fishing vessel navigates turbulent waves in Sri Lanka. Ocean warming intensifies weather patterns. (Image by ZHU Jiang)
A multi-national team of scientists from China, USA, New Zealand, Italy, and France analyzes the temperature of the Earth every year. These scientists have found a fever that is increasing every year. For the past decade, each year has been hotter than the previous year in the ocean. And there are other changes in the ocean that also matter.
The results were published in Advances in Atmospheric Science on January 11.
Ocean is an important part of the Earth's climate system, it covers 70% of the planet and absorbs about 90% of the heat from global warming. It helps control the atmosphere-a warmer ocean leads to a warmer and moister atmosphere with wilder weather. It also controls how fast the Earth's climate changes. To know what has happened or what will happen to the planet, answers can be found in the ocean.
Data of this study were obtained from two research teams: the Institute of Atmospheric Physics (IAP) at the Chinese Academy of Sciences and the National Centers for Environmental Information of the National Oceanic and Atmospheric Administration (NOAA). Based on temperature measurements analyzed by the IAP, the world ocean heated by 15 zettajoules relative to 2022. According to NOAA, the heating was smaller, nine zettajoules. Both groups reported another year of warming, but their magnitudes differ. But first, what is a zettajoule? Every year, the entire globe consumes about half a zettajoule of energy to fuel our economies. A zettajoule is an enormous amount of energy. Another way to think about this is that 15 zettajoules is enough energy to boil away 2.3 billion Olympic-sized swimming pools (50 meters long, 25 meters wide and two meters deep).
Why do the values differ? Scientists are working hard to find out, and early clues point to the way each group handles the data. Big differences arise from "quality control" and how individual values are mapped onto a global grid. In particular, in a warming climate, new high ocean temperature measurements can be erroneously discarded.
"This means that the warming might be greater than the numbers reported here," said Dr. CHENG Lijing from IAP, lead author of the study.
According to the two data sets used in the study, the ocean has been warming since the late 1950s, and both show long-term warming. There is a long-term warming in the ocean due to global warming and the two groups (IAP and NOAA) agree on the long-term trends, although a particular year may differ.
The blowout record of ocean surface temperatures is caused by both long-term global warming and short-term fluctuations in water temperatures in the Pacific Ocean (El Nino). Currently, both are contributing to warmer water at the ocean surface. A now strong El Nino event in the tropical Pacific has been building on global warming and climate change to warm ocean surface temperatures since May, 2023.
This, in turn, is changing weather patterns around the world. Therefore, it is the relatively small natural year-to-year variability in the OHC relative to the warming trend that makes the OHC such a good indicator of climate change.
Rainfall and evaporation patterns are also changing, altering the salinity of the ocean. Salty areas become saltier and fresh areas become fresher, affecting marine life and ocean currents.
Less dense, warm, and fresh water near the surface tends to stay near the surface, unable to transport heat and carbon dioxide to deeper layers. Scientists call such water "stratified". The new data show that stratification continues to increase. This reduces the oxygen in the ocean and its ability to absorb carbon dioxide, with severe consequences for the ocean's plant and animal life.
A warming ocean also supercharges the weather. The extra heat and moisture that enter into the atmosphere make storms more severe, with heavier rains, stronger winds, and more significant floods. There is tremendous damage around the world (about $200 billion USD each year in the U.S. alone), as well as major disruptions and loss of life.
These results underscore the need to immediately stop burning fossil fuels and adding more carbon dioxide to the atmosphere by decarbonizing the economy and switching to lower-cost, cleaner, renewable energy such as wind, solar, and hydroelectric-power.
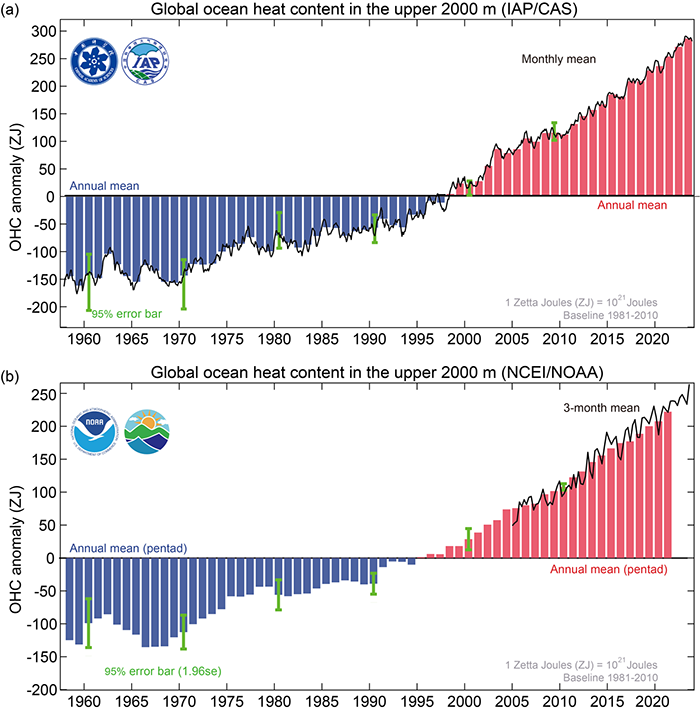
Fig. 1. Global upper 2,000 meters OHC from 1958 through 2023 according to (a) IAP and (b) NCEI/NOAA (1 ZJ = 1,021 Joules). The line shows (a) monthly and (b) seasonal values, and the histogram presents (a) annual and (b) pentad anomalies relative to a 1981–2010 baseline. (Image by CHENG et al.)
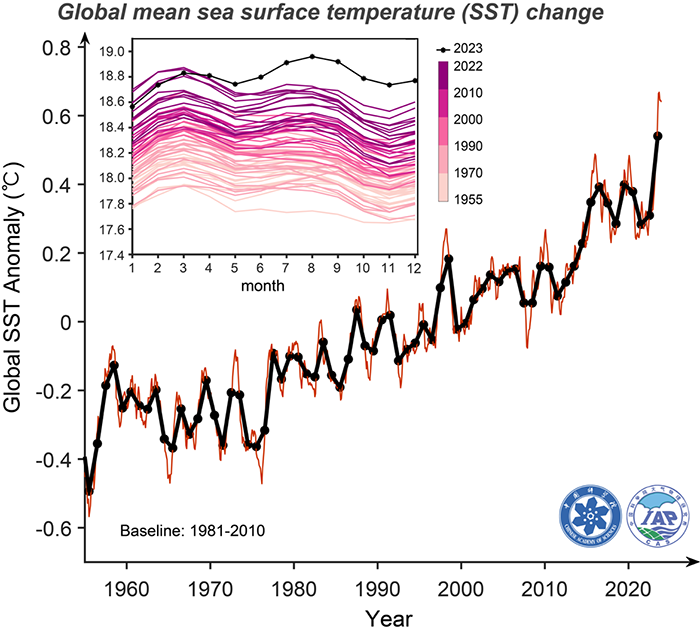
Fig. 2. Global SST changes from 1955 through 2023 according to first level (1 m) data in the IAP temperature gridded analysis (℃). The black line is the annual value, and the red is the monthly value. The anomalies are relative to a 1981–2010 baseline. The within-year variation of SST is shown in the inner box, with 2023 values shown in black. (Image by CHEg et al.)
Ocean Temperatures Help Make 2023 the Hottest Year on Record (Video by ScienceApe)
Contact