
Nonalcoholic fatty liver disease (NAFLD) is delineated as hepatic fat accumulation exceeding 5–10% of liver weight that is not due to alcohol, autoimmune, viral or other known causes. NAFLD comprises an entire pathological spectrum ranging from simple steatosis to nonalcoholic steatohepatitis (NASH), advanced fibrosis, and cirrhosis. It is a major risk factor for various metabolic syndromes such as type 2 diabete, obesity and cardiovascular disease. It is widely accepted that nonalcoholic steatosis has a benign clinical consequence, while patients with NASH have a higher risk of progression into advanced fibrosis, cirrhosis and liver cancer. Therefore, it is important to dissect the critical transition stage and the corresponding factors that drive the transition from hepatosteatosis to NASH.
To address the problem, the collaboration research between Prof. CHEN Luonan’s group from Institute of Biochemistry and Cell Biology, Shanghai Institutes for Biological Sciences (SIBS), CAS and Prof. YIN Huiyong’s group from Institute for Nutritional Sciences, SIBS, CAS was conducted. Researchers measured the mass spectrometry (MS)-based shotgun lipidomics of plasma and liver tissue from mouse model of high fat-induced NAFLD. By applying the Dynamical Network Biomarker (DNB) theory which can detect early warning signals before the system transits from a state to another, they identified a critical transition stage (termed pre-NASH) during the progression from hepatosteatosis to NASH. Different from the conventional biomarker approach based on the abundance of molecular expressions, the DNB model exploits collective fluctuations and correlations of different metabolites at a network level.
In this work, researchers found that the correlations between the blood and liver lipid species drastically decreased after the transition from steatosis to NASH, which may account for the current difficulty in differentiating NASH from steatosis based on blood lipids. Furthermore, most DNB members in the blood circulation, especially for triacylglycerol (TAG), were also identified in the liver during the disease progression, suggesting a potential clinical application of DNB to diagnose NASH based on blood lipids. Researchers further identified metabolic pathways responsible for this transition. The discoveries suggest that the transition from steatosis to NASH is not smooth, and the existence of pre-NASH may be partially responsible for the current clinical limitations to diagnose NASH. Clearly, the study opens a new way to reliably diagnose pre-NASH so as to achieve early intervention of NAFLD.
This work entitled “Discovering a critical transition state from nonalcoholic hepatosteatosis to nonalcoholic steatohepatitis by lipidomics and dynamical network biomarkers” was published in J Mol Cell Biol on Mar. 18, 2016.
This work was supported by the grants from the Chinese Academy of Sciences and the National Natural Science Foundation of China.
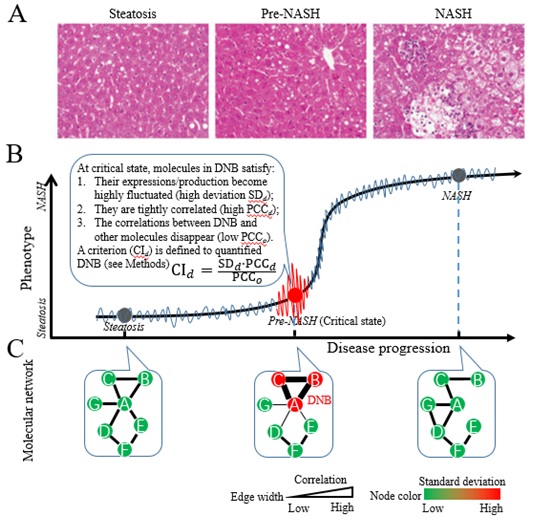
A brief description of DNB theory. (A) Representative pictures of H&E staining for the three states of NAFLD. Clearly, there is no significant difference between steatosis and pre-NASH but significant difference between NASH and pre-NASH. (B) Three criteria for DNB molecules and the quantitative index CId are depicted. Based on average expressions of lipids, pre-NASH state is indistinguishable from steatosis but is different from NASH. Thus, the traditional biomarkers based on differential expressions failed to identify pre-NASH samples from steatosis. However, DNB methodcan identify pre-NASHsamples basedon the three criteria dueto differential correlations and differential deviations rather than differential expressions. (C) Network view of the DNB molecules and alterations of their interactions at different disease stages. At the pre-NASH state, DNB is the network satisfying the three criteria. Edge width corresponds to the correlation, and node color corresponds to the standard deviation of the nodes. (Image by Prof. CHEN Luonan's lab)

86-10-68597521 (day)
86-10-68597289 (night)

86-10-68511095 (day)
86-10-68512458 (night)

cas_en@cas.cn

52 Sanlihe Rd., Xicheng District,
Beijing, China (100864)
Copyright © 2002 - Chinese Academy of Sciences


