
Coupled climate models feature large uncertainties in their simulations and projections of global warming. One particular type of uncertainty arises from the influence of climate drift due to the presence in pre-industrial control (PICTL) simulations. Designed by CMIP5, the simulation global warming employs initial values from the PICTL simulations and the same physical processes used in the PICTL simulations.
Climate drift refers to spurious trends simulated in coupled models, and has been a focus in the development of coupled models. Thus, studying the long-term behavior of PICTL simulations in coupled models is important for estimating the rates of global warming. Obvious trends still existed in some CMIP3 models. Do these obviously spurious trends associated with climate drift persisting in the current CMIP5 models, and, if so, how does this problem affect the warming simulated by CMIP5 models?
Scientists from Institute of Atmospheric Physics demonstrate how state-of-the-art coupled models control climate drift in Surface Air Temperature (SAT) in their PICTL simulations, as well as to estimate their possible contribution in quantifying global warming in a work recently published in Atmospheric and Oceanic Science Letters. They also present the relationship between the SAT tendency and the heat fluxes at the Top of Atmosphere (TOA), and that between the SAT and ocean temperature (OT, layer-defined temperature), to explore the causes and effects of long-term SAT trends.
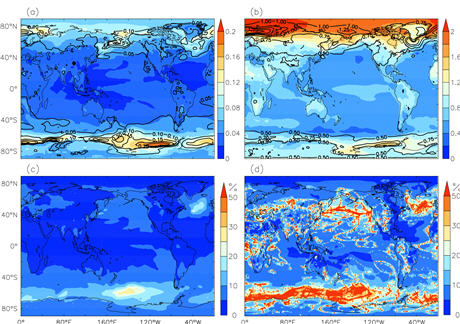
Figure (a) Ensemble mean (shaded) of the absolute values of the SAT linear trends and RMSD (contours) of the absolute values of the SAT linear trends during the whole period in the 27 PICTL runs. (b) Ensemble mean (shaded) of the historical trends and RMSD (contours) of the historical trends during the period 1901–2005 in the 27 historical runs. (c) The ratios (%) of the ensemble mean of the absolute values of the SAT linear trends during the whole period in the PICTL runs to the ensemble mean of the historical (1901–2005) trends from 27 models. (d) Ensemble mean of the ratios (%) of the PICTL trends during the whole period to the historical trends (1901–2005) from each model. The contour intervals are 0.05°C/100 yr and 0.25°C/100 yr in (a) and (b), respectively. (Figure plotted by IAP)
Small trends (< 0.06°C/100 yr) in the globally averaged SAT (GASAT) exist in most CMIP5 models. Of these, positive (negative) trends result from positive (negative) net radiation fluxes at the TOA. This finding was further confirmed by the significant positive correlations between the TOA and the SAT tendency. The PICTL GASAT trends constitute less than 10% of the historical trends, indicating that such trends are of negligible importance in estimates of historical global warming in most models.
Spatially, relative to the historical trends, the PICTL trends comprise a nontrivial fraction (>20%) in the Southern Ocean between 50°S and 65°S and in the northern Atlantic and Pacific oceans north of 40°N, with large inter-model spread. It's therefore concluded that the long-term behavior of SAT is significantly related to ocean circulation adjustment in the mid–high latitudes.

86-10-68597521 (day)
86-10-68597289 (night)

86-10-68511095 (day)
86-10-68512458 (night)

cas_en@cas.cn

52 Sanlihe Rd., Xicheng District,
Beijing, China (100864)
Copyright © 2002 - Chinese Academy of Sciences


