
The Western North Pacific Subtropical High (WNPSH) is a crucial system with profound impact on East Asian summer climate. The WNPSH determines not only the location of the subtropical rain belt over East Asia (Fig. 1), but also the track of the tropical cyclones over western North Pacific. The possible future change of WNPSH in response to the ongoing global warming has been of great concern to the community and the society.
In a recent paper published at Scientific Reports, Dr. HE Chao and Prof. ZHOU Tianjun in the Institute of Atmospheric Physics, Chinese Academy of Sciences, and other co-authors addressed the future change of WNPSH under anthropogenic greenhouse gases (GHG) forcing. The anticyclonic circulation of WNPSH is mainly composed by the meridional shift of tropical easterly wind and mid-latitude westerly wind (Fig. 1). Consistent results based on the multiple models participated in CMIP5 under RCP8.5 scenario show that the WNPSH would be weakened and retreated eastward under GHG forcing (Fig. 2), accompanied by the eastward expansion of subtropical East Asian rain belt. The weakened anticyclonic circulation of WNPSH is mainly dominated by the weakened westerly wind on the northern flank of WNPSH, while the weakened easterly wind on the southern flank of WNPSH has a secondary contribution (Fig. 3a).
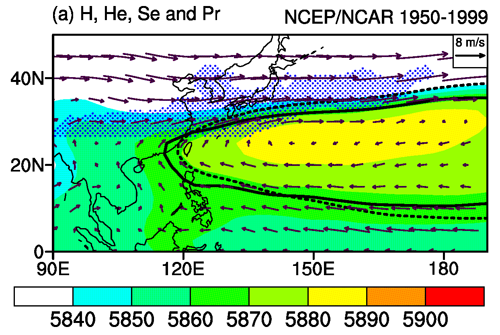
Fig. 1 Observed mean state of WNPSH and East Asian subtropical rain belt in summer. The shading indicates geopotential height, and the vectors indicate winds. The blue dotted region is the East Asian subtropical rain belt with precipitation intensity above 5mm/day. The Solid and dashed black lines are the zero contours of eddy geopotential height and eddy stream function, which indicate the boundary of WNPSH. It is evident that the subtropical rain belt over East Asia is located along the northwestern boundary of WNPSH. (He et al, 2015)
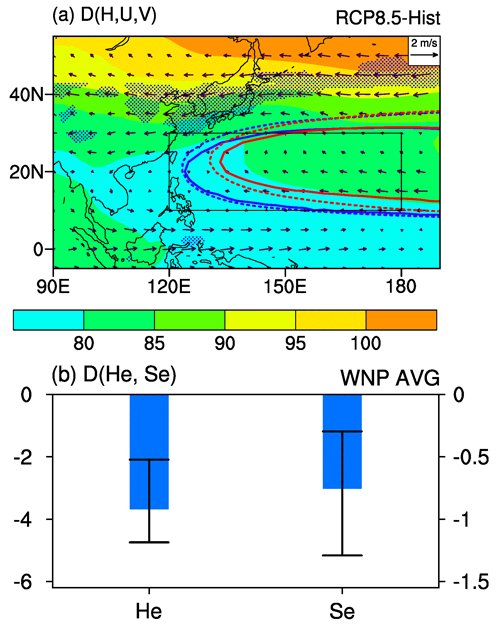
Fig. 2 The RCP8.5 projected changes in geopotential height (shading) and winds (vectors) relative to the Historical period. The changes in wind agreed by 75% of the individual models are stippled. The boundaries of the WNPSH for current and future climates are indicated by blue and red lines, respectively. (He et al, 2015)
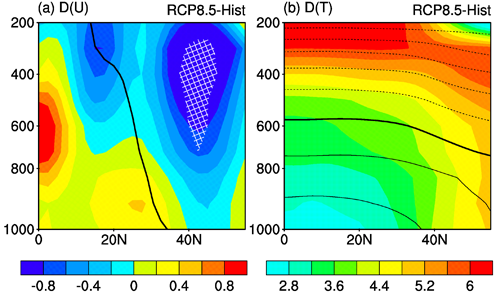
Fig. 3 The latitude-height profiles of the projected changes in zonal wind (a) and temperature (b) averaged within 1200-1800E. The black line in (a) indicates the interface between tropical easterly wind and mid-latitude westerly wind. The black lines in (b) are the climatological isotherms. (He et al, 2015)
The weakened WNPSH in the mid-troposphere can be well explained by the warming pattern. The warming on the southern flank of WNPSH is horizontally uniform due to the "mixing" effect of equatorial waves. In contrast, greater warming is seen at higher latitudes on the northern flank of WNPSH where the equatorial waves are absent (Fig. 3b). The weakened meridional temperature gradient on the northern flank of WNPSH is responsible for the weakened mid-tropospheric westerly wind on the northern flank of WNPSH, according to the law of thermal wind.
This study answered how and why global warming would impact the WNPSH. It provides a useful reference to the understanding of the future changes of temperature and rainfall over East Asia, since the WNPSH is the most important circulation factor regulating East Asian climate variability in summer.

86-10-68597521 (day)
86-10-68597289 (night)

86-10-68511095 (day)
86-10-68512458 (night)

cas_en@cas.cn

52 Sanlihe Rd., Xicheng District,
Beijing, China (100864)
Copyright © 2002 - Chinese Academy of Sciences


